Maven Churn Challenge
Link to GitHub repository, including data and final output.
1. Problem
A telecommunication company based in California wants to understand who their high-value customers are, and reasons by their customers’ movements. Understanding drivers behind customer’s movement will assist with the overall customer retention. While identifying high-value customers will aid in resource allocation in customer support. Overall, the project should result in maintaining regular customers, stabilising revenue.
2. Data
This dataset contains 2 tables, in CSV format:
The Customer Churn table contains information on all 7,043 customers from a Telecommunications company in California in Q2 2022
>> Each record represents one customer, and contains details about their demographics, location, tenure, subscription services, status for the quarter (joined, stayed, or churned), and more.
The Zip Code Population table contains complimentary information on the estimated populations for the California zip codes in the Customer Churn table.
The data is clean and 100% usable, hence no cleaning is required.
3. Analysis
Firstly, we need to understand the current situation regarding customers’ movements. This requires calculating the number of customers from the prior period, the new customer who joined and/or left, and the current customers.
>> Current customers are those who have “Stayed” or “Joined” as their customer status.
>> Customers that left in the last quarter as those labelled as “Churned”.
>> New customers have a tenure of less than 4 months. They may be labelled as “Joined” or “Churned”. Some customers could join and leave within the same quarter.
>> Customers from the prior period would be Current customers + Churned customers - New customers.
Once we have the information above, we can calculate the Churn rate to see how we perform. In addition, we can also calculate the financial impact of losing customers by comparing their monthly charges and the total monthly charge.
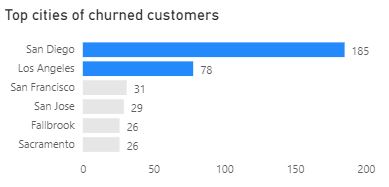
Secondly, we shall explore the characteristics of Churned customers to find the common patterns between them. This involves plotting bar charts counting customer IDs distributed across categories within demographic features (location, age, type of services used, the given reason for leaving and so on). Categories that stand out from the rest should be reported.
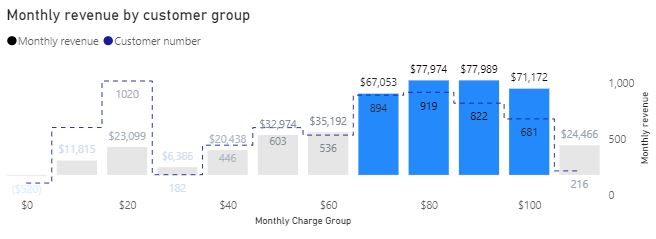
Finally, to determine high-value customers, we need to categorise them into groups and compare them to find out which groups generate the most revenue for us. I decided to categorise them based on the monthly charge, then evaluate the number of customers in each group and their associated revenue. One last step is locating high-value customers in terms of physical location to better allocate resources in those areas.
4. Results and Recommendations
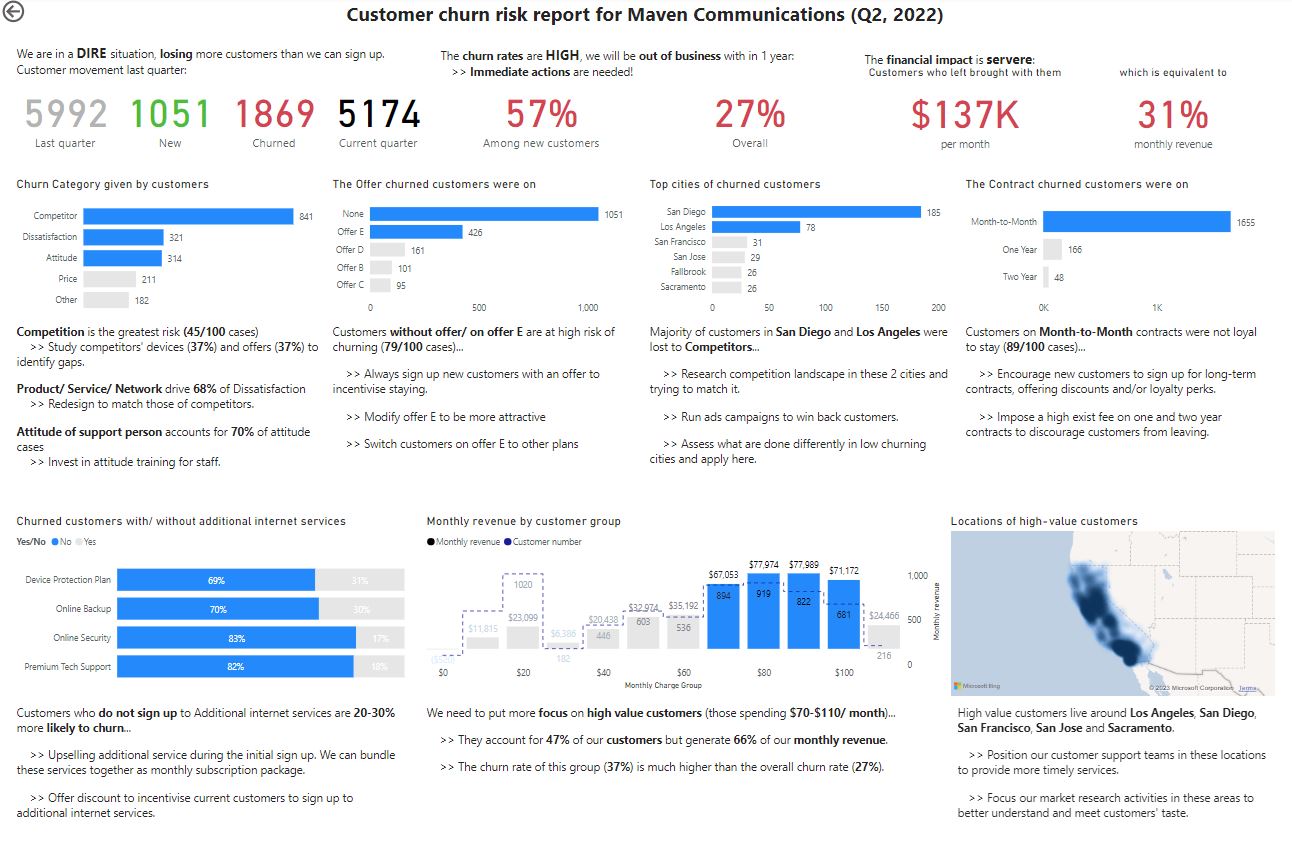
Current situation:
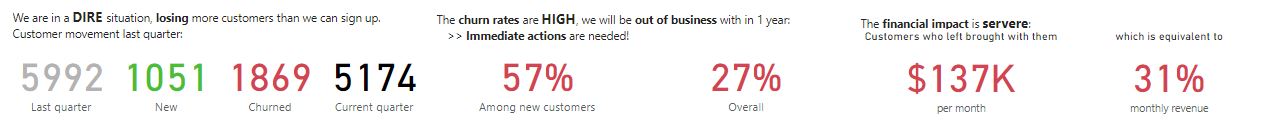
This led to a reduction of $137k (or 31%) of monthly revenue.
Immediate actions are needed to rectify the current situation or the company will be out of business within a year.
Characteristics of churned customers:
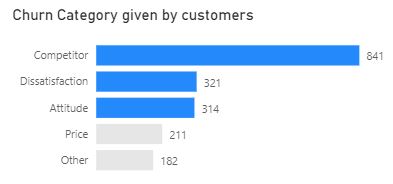
>> We need to investigate the offers of our competitors to identify their selling points that outperform us.
Dissatisfaction with product/ service/ network accounted for 68% of this category.
>> Benchmark our product/ service/ network with competitors and industry standard to identify weakness and improve.
70% of customers who left because of our Attitude pointed to the attitude of support personnel as the pain point.
>> Invest in attitude training for staff to address this issue.
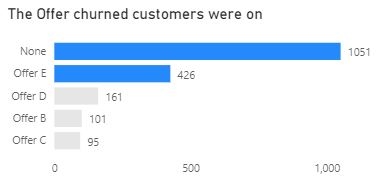
>> Move current non-offer customers to an offer to avoid churning.
>> Offer E also performed poorly in keeping customers.
>> Move customers of offer E to other offer or modify offer E to be more attractive.
>> Research offers made by competitors and try to match them.
>> Run ads campaigns to win back customers.
>> Assess operation in low-churning cities and apply it high-churning locations.
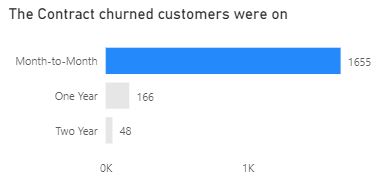
>> Encourage new customers to sign up for long-term contracts, offering discounts and/or loyalty perks.
>> Impose a high exist fee on one and two year contracts to discourage customers from leaving.
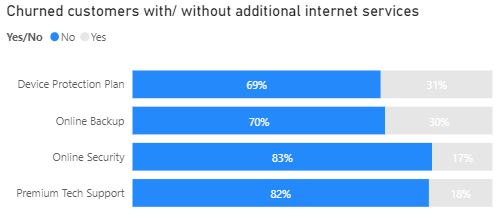
>> Upselling additional service during the initial sign up. We can bundle these services together as monthly subscription package.
>> Offer discount to incentivise current customers to sign up to additional internet services.
High-value customers:
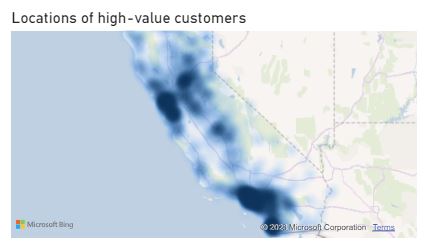
>> Position our customer support teams in these locations to provide more timely services.
>> Focus our market research activities in these areas to better understand and meet customers' tastes and competitors’ offerings, then match them with quality.
>> Customers did not cite Price as a major factor for leaving. Therefore, quality seems to play a key role here.
5. Technical Details
This project used entirely Power BI to analyse and visualise the results.
6. Limitation
The data is limited to the second quarter of 2022. Therefore, we cannot determine if there are any seasonal factors in play. Further analyses using data over a longer period of time (about 5 years) is necessary.